Monitoring and observability in the era of the cloud
What is the difference between monitoring and observability? What is a metric? And a log?
How is all of this related to alerting and incidents? Please, bear with me while we start by introducing some of the terms that will be key for the rest of the article.
Keep things running with Dynamics 365 Business Central
When we talk about monitoring, we talk about performing an action, an action against our applications and systems, keeping an eye on their state. We monitor applications to detect errors and anomalies and find the root causes of these problems. We also monitor systems to anticipate its future needs: will the system require higher capacity? Is the current and past data screaming to me that unless I correct something the application may stop working? Monitoring allows me to understand the state of a system over a period of time.
Observability on the other hand is a property of a system. It is a term that comes from system control theory and it is a measure of how well the internal states of a system can be inferred from knowledge of its external outputs.
If you search for these two terms in the internet you will find a fierce discussion everywhere. Observability is the new buzzword in the neighborhood and everyone wants to jump into the bandwagon. People mistakenly use these two terms interchangeably, while their relationship is more of a symbiosis: one cannot live without the other. Poor monitoring on a perfect observable system will miss most of the great insights the system exposes. On the other hand, perfect monitoring on a poorly observable system will not be able to draw the necessary insights to understand its states.
With this in mind, how do we actually extract information from these applications and systems? We have different tools. Some of them are logs and metrics and we will focus on those here:
A log message is a set of data generated by a system when an event has happened to describe said event.
- For example, you are a doctor trying to figure out why your patient has a headache today, so you take a look at what happened yesterday and you read the following story:
- 8 AM – Woke up and had breakfast. Nice eggs and bacon.
- 9 AM – Went to work. Work hard.
- 5 PM – Left for home. Had a nap.
- 8 PM – Went for Company Party. Nice wine. I can’t remember much after 10 PM…
Those logs give you a lot of information, a large part of it unnecessary for your particular task but hidden in there you can identify the root cause of your pain (in this particular example, literal pain).
Metrics are measurements of the system at a specific point in time. They consist of a metric name, a value (measurement) and a series of dimensions that help to identify the context of this metric emission.
- Following the previous example, a doctor will get measurements of your health via different methods. For example, a blood test will show things like:
- 2018-01-01 9:30 Glucose – 140
- 2018-01-01 9:30 Blood Count – Type: Red Cells – 3.88
- 2018-01-01 9:30 Blood Count – Type: White Cells – 5.10
If you get multiple measurements across time, you can draw the evolution of these metrics as a time series and help you understand a degradation or a clear sign that something is going wrong.
All of this is great, but in a complex system generating a very large number of metrics and logs, we cannot expect people to be able to actively and continuously monitor the system by looking at metric values and logs and infer when something is wrong. Apparently, people need to sleep; so how can we ensure that sudden high spike of glucose in a diabetic person does not go unnoticed?
That is where alerting comes into play. You can define a set of rules that if a series of values for a metric fulfills, a ticket or incident will be created. This incident will be an actionable record of something that went wrong and will potentially – depending on its severity – raise the alarms and bring the cavalry with maximum urgency to deal with its consequences.
So, looking at these capabilities we can also think of monitoring as the process of using your metrics and alerting logic to evaluate whether or not to create an incident. And to use your logs to discover the root cause of said incident.
In contrast, observability would dictate if that incident is actually meaningful and not just noise and would allow you to draw a connection between the metrics telling you that something went wrong and the logs explaining what specifically did.
Wait, wait… why is this important again?
We are living in a pretty complex world when speaking about software. Systems that were already difficult to manage are getting more and more complicated for many reasons, among them:
- Services are getting split into many interconnected pieces forming microservices.
- These microservices are replicated and distributed across many nodes at a vary large scale thanks to tools like Service Fabric or Kubernetes.
- Often, these microservices are deployed in containers within a node, adding another grade of complexity.
- On top of all that, deploying these solutions in the cloud means that the machine hosting the code may be in a different part of the world and may not be accessible.
If you remember or you still have some physical servers that you manage, you know the required effort to keep them up and running appropriately. Companies that maintain their own solutions on premise would often have full-time IT people working on this problem.
Now imagine the same thing at a crazy scale, with hundreds of thousands or millions of virtual machines, databases, servers and other components under your responsibility. Your monitoring and observability story must be rock solid if you want to provide a reliable and stable service.
What do we do in Business Central?
Being a SaaS (Software as a Service) offering, when you join Business Central, Microsoft manages all of these needs for you. You do not need to worry anymore about buying expensive servers, installing all necessary software, buy new disks when you run out of space or avoid everything freezing in the middle of the most frantic period of work.
These are some of the numbers we manage internally:
- Around half a million metrics emitted per minute.
- 7.87 Terabytes of logs emitted every day.
- 3.8 Terabytes of data per day uploaded to our analytics systems.
This data allows us to have dashboards with useful graphs like the following:
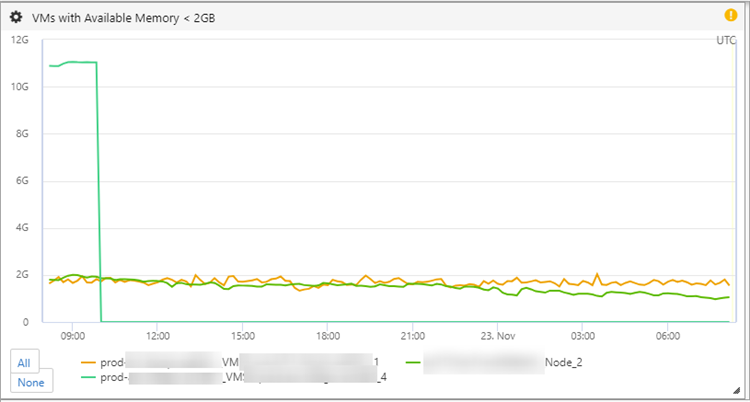
Knowing which particular machines are low on memory help us react before the system freezes and customers are impacted.
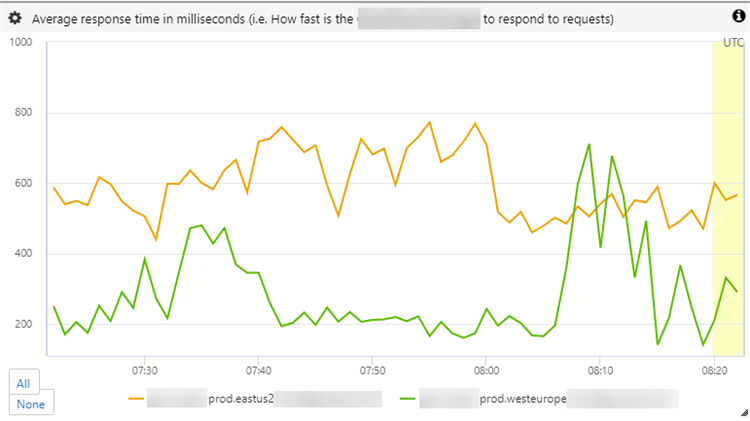
We can quickly see that the instance of this particular component in eastus2 region is slower to respond. Now we will use the logs to figure out why and make it better before it degrades the customers’ experience.
But as mentioned before, when you have so much information from so many different nodes in your system, manual inspection is not an option. Here is where your alerting logic and your automatic incident creation takes the spotlight:

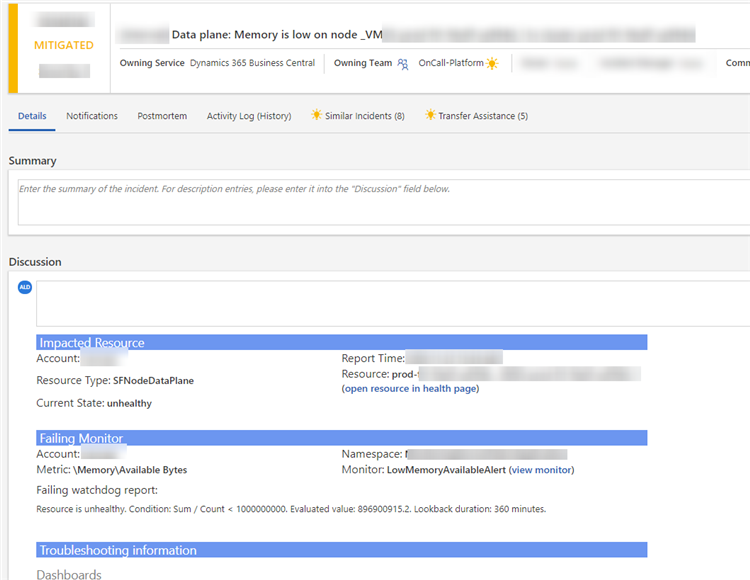
Depending on the severity of the incident, the on-call engineer will be called to mitigate the problem with very strict deadlines to minimize customers’ impact.
When working at this scale of components and users it is not a question of if a problem will happen, it is a question of when it will happen. Statistics are merciless and with these large numbers it means that sooner or later that very strange edge case that should have never occurred will actually mess up your carefully aligned system. That is why we work very hard on bringing down two main indicators that explain how well we are reacting in these situations:
- TTD or Time To Detect
- TTM or Time To Mitigate
If we are able to react very fast when that inevitable problem occurs: we detect it instantly (or beforehand!) and quickly fix it so it never affects our customers; then we can definitely go to bed satisfied with a work well done (and do not get awaken in the middle of the night when that incident actually happens!).
Where the wild future goes
All these things considered, what are we doing now to make this picture even better? Well, there are a lot of exciting opportunities in this area. As many other core problems that we face when developing software, monitoring and observability have different stages. Before being able to mature your solution, you need to leave the infancy state; you need to have your basic building blocks in place if you want to start making skyscrapers.
We are currently in a great position to incorporate further automation into these workflows. After fixing some of these incidents and precisely identifying the root cause and its optimal mitigation… why not automate the fix if it happens again? Auto healing is one of the areas that we are putting our resources on.
Another key usage of this large amount of data is to understand in a much deeper manner the different ways our customers use our system. What do they find useful? What do they do not? What are their main pains? What features are they missing dearly? How can we anticipate their needs and evolve our product accordingly in that direction? That is where expanding to a more data driven approach across most of our business decisions is so important to make our customers’ life better.
Last but not least, why to limit ourselves to what us poor humans can see and understand? When we are talking about petabytes of data, we are talking about a beautiful playground for machine learning and AI to identify patterns that we cannot. How can we make your business better? How can we warn you in time if a risk is coming on the horizon? How can we help you identify the next huge deal that will make you and your company thrive? Well, it may be for your AI-based personal assistant to say.
The next FAQ is about What is the Dynamics 365 Business Central user assistance model?
If you want to try this but don’t yet have a Business Central trial, that’s an easy fix. Just contact us!
Re-posted from Microsoft | Dynamics 365 Business Central Blog by Agustin L.


